After Talk with Dr. Ruby - Discussion about Vax Lot Variability Data and What it Means

May 18, 2023
Share

We talked about lot-to-lot analysis of C-19 injections from the Danish government data by Max Schmeling, a statistician/economist.

Link to the published letter in European Journal of Clinical Investigations

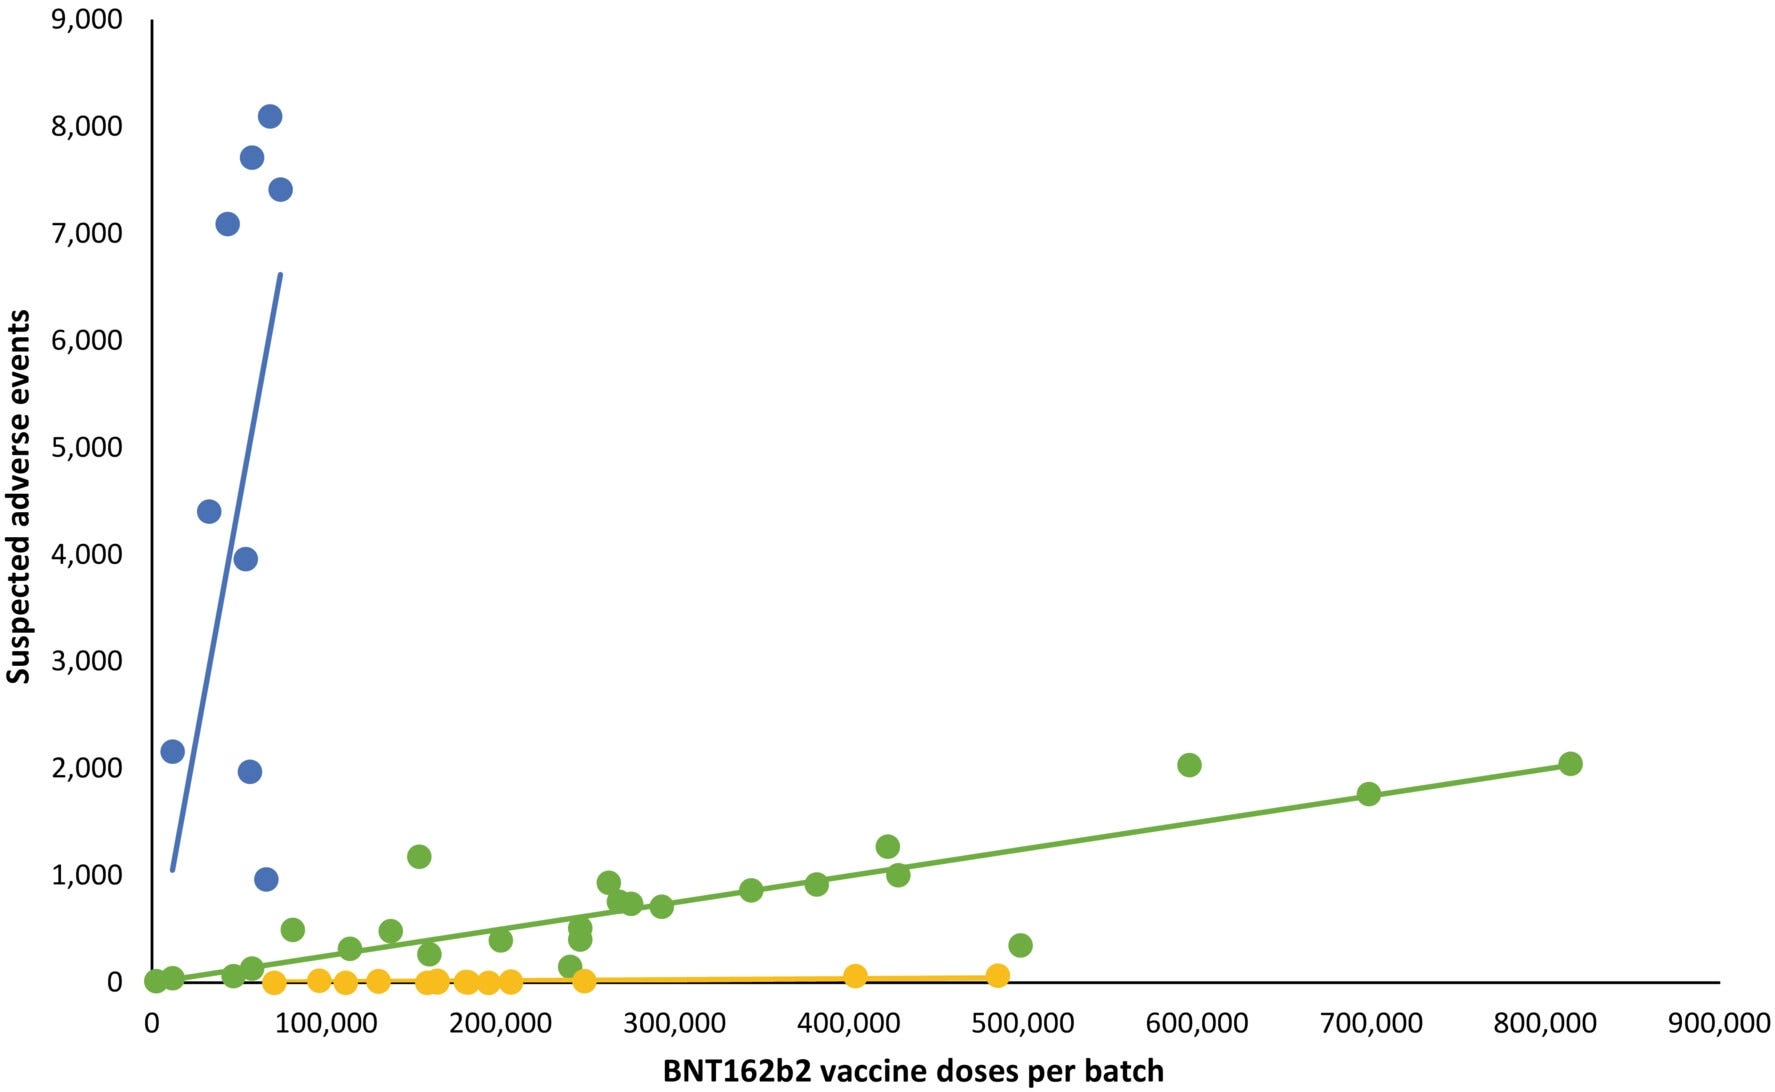
In the video I am referring to this graph and the fact that the blue and green dots are so cleanly separated into very distinct groups. The yellow ones are also extremely different from the blue and statistically different from the green. The empty space in between is also telling. While there is a huge variability lot-to-lot - which would be bad enough as it indicates uncontrolled manufacturing. However, the fact that the 3 groups are so distinct from each other shows that this variation is not random. It shows a clear pattern which indicates intent, and experimental design or a targeted deployment. In this case there are clearly small extremely toxic lots (blue) introduced among medium-low and low toxicity lots which are larger in size.

Craid Paardekooper found the same issue - non random patterns in the toxicity of lots early on in the roll out campaign.

Another point I am making in the video is that it is impossible to tell the composition of the mRNA injections by looking at a small sample of 100 or even 1000 vials. That is because of the extreme variability of these substances. Statements like “there is no RNA” or “it’s all graphene” are simply not scientifically valid, as given what we know about the manufacture and variability, there is no way to determine this with certainty for all vials that have been shipped all over the world.