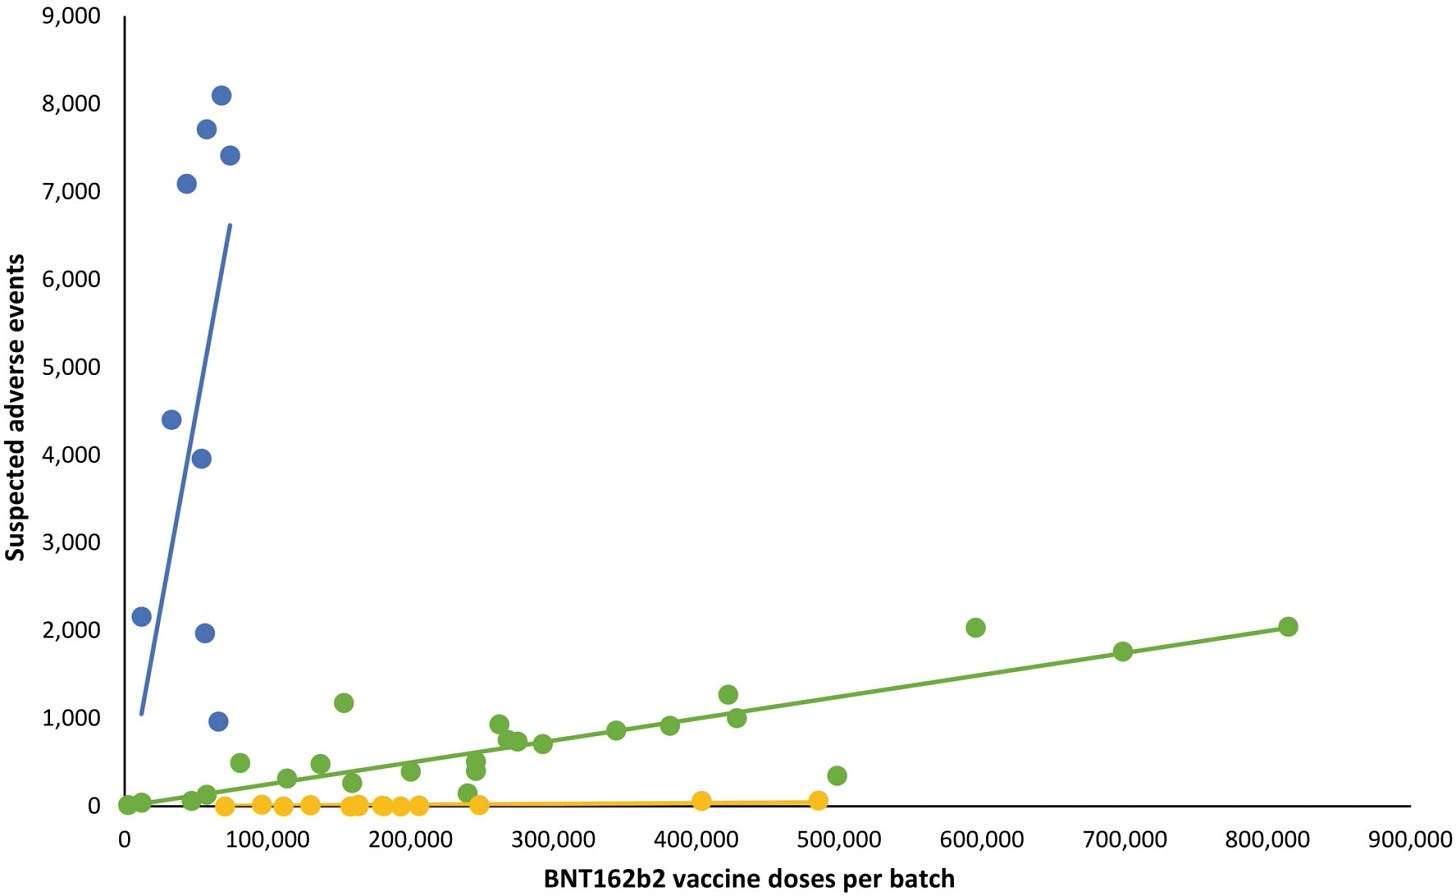
We talked about lot-to-lot analysis of C-19 injections from the Danish government data by Max Schmeling, a statistician/economist.
Link to the published letter in European Journal of Clinical Investigations
In the video I am referring to this graph and the fact that the blue and green dots are so cleanly separated into very distinct groups. The yellow …
Watch with a 7-day free trial
Subscribe to Due Diligence and Art to watch this video and get 7 days of free access to the full post archives.


